, Magnetic Resonance Imaging (MRI)")
The word “light” brings up familiar images. The common image of “light” is that of something we see. Yet, the “light” that we can see is only a small slice of a much larger range of waves that are known as the “electromagnetic” spectrum. The entire “electromagnetic” spectrum is considered to be “light.” Yet, vast majority of the “electromagnetic spectrum of light” is invisible.
This concept, and many more concepts pertaining to light, are explained in the 2017 book by astronomers Bob Berman, titled (1):
Zapped: From Infrared to X-rays, the Curious History of Invisible Light
Berman notes:
There is a “whole world of light outside our range of vision.”
Berman also explains that all light is in packets of energy (photons) that travel in waves. He states:
“Photons constitute 99.9999999 percent of everything.”
The waves of light have different lengths (known as wavelengths). The wavelength is the distance from crest to crest for two adjacent waves. What makes light visible or invisible is its wavelength. Wavelengths shorter than the visible spectrum are invisible. Wavelengths longer than the visible spectrum are also invisible. A typical graph of the electromagnetic spectrum of waves includes:
We can only see the wavelengths in the visible spectrum of light. All of the other wavelengths are invisible to the human eye. The different wavelengths of the electromagnetic spectrum have different characterizes (positive and negative applications and influences):
- Gamma: They have so much energy that they damage genetic material, causing mutations.
- X-Rays: They also have so much energy that they damage genetic material and cause mutations. But, they also have beneficial applications, such as making diagnostic images like x-rays and CAT scans.
- Ultraviolet: They also have sufficient energy to damage genetic material and cause mutations, particularly skin cancers. However, they are required to help the body make the critically important vitamin D.
- Visible: These are the wavelengths that we can see, including all of the various colors around us. The different wavelengths within the visible spectrum account for the different colors we can perceive.
- Infrared: These wavelengths have some therapeutic applications, and they are most notorious for generating heat.
- Microwave: These wavelengths can rapidly cook food and boil water. They also have a number of technological applications, such as wireless communications and radar.
- Radio: Best known for their ability to be used to broadcast radio, hence the name.
The wavelengths of X-rays have diagnostic significance. Their discovery in 1895 allowed health care providers to visualize bones, joints, and other structures. This application for x-rays was discovered by German physicists Wilhelm Conrad Rontgen. Rontgen was awarded the first Nobel Prize in Physics for his discovery in 1901. Rontgen did not understand that the high energy generated by x-rays would damage genetic material and cause genetic mutations. Rontgen died of radiation poisoning.
Polish scientist Marie Curie earned two Nobel Prizes. Her first was in Physics, awarded in 1903, for her pioneering work in radioactivity, a word she coined. Her second Nobel Prize was in Chemistry, awarded in 1911, for her discovery of the radioactive elements radium and polonium. Curie also did not understand the high energy generated by radioactivity wavelengths, including the energy produced by her elements radium and polonium, which also damaged genetic material and caused genetic mutations. Curie also died of radiation poisoning.
Walter Bradford Cannon was an American physician and physiologist. He was Chairman of Harvard Medical School’s Department of physiology for about forty years. His research expanded upon the concepts and importance of physiological homeostasis (a word he also coined) and the “fight-or-flight” response of the sympathetic nervous system. His investigations included exposing volunteer subjects to diagnostic x-rays to determine the digestion of food when exposed to periods of calm v. stress. Like Rontgen and Curie, Cannon did not understand that the high energy generated by x-rays would damage genetic material and cause genetic mutations. Cannon also died of radiation poisoning.
Computed Axial Tomography (CAT or CT scan) is technology that allows for rapid axial (“slice-of-bread”) x-rays of parts of the body. Because many slices of x-ray exposure are made, the subject is exposed to higher levels of x-ray radiation. This allows for a unique and often valuable imaging of the body, but at the cost of increased risks of genetic damage and mutations for the subject.
Magnetic Resonance Imaging (MRI or MR) also images the inner body, but without causing genetic damage. MRI exposure time is much longer and they are more expensive.
Some of the first applications for x-rays was to image the human spinal column. These early x-rays were known as spinographs. Today, chiropractors often make great use of all three modalities (x-rays, CAT, MRI), and many chiropractors have x-ray machines in their clinical offices.
The most common modality for imaging used by chiropractors is x-rays. As noted, many chiropractors have x-ray machines in their clinical offices. Chiropractors expose x-rays on patients for a number of reasons, including:
- To discover and/or rule out diseases that should be referred to medical specialists, such as cancer or infection or some metabolic diseases.
- To document degenerative diseases of the spine, particularly pertaining to the discs, facet, central canal and lateral recess.
- To document congenital anomalies such as facet tropism, lumbosacral transitional segments, hemi and/or demi vertebrae, additional or missing ribs, block vertebrae, central canal stenosis, etc.
- To document prior spinal pathologies, such as Schmorl’s nodes, spondylolysis, spondylolisthesis, fractures, etc.
- To assess the unique and specific biomechanics on an individual patient in order to optimize the specific line-of-drive for the spinal adjustment as well as to influence various rehabilitation intervention to assist with spinal remodeling programs.
••••••••••
Terminology
The structure that is most critical to spinal health is the intervertebral disk. The intervertebral disk functions as a shock absorber while allowing for the incredible mobility of the spinal column The disk itself is not seen with x-rays but the disk space can be viewed. The size of the disk space is a window into the integrity of disk function.
The internal disk structure can be viewed with both CAT and/or MRI scans.
The intervertebral disk can suffer from a number of acquired and/or pathological changes that may have clinical importance. These changes include degeneration, desiccation (drying out), fissures (cracks that breach the integrity), and herniation (movement of diskal material towards the nervous system: spinal cord, cauda equina, nerve root).
The terminology pertaining to lumbar spinal disk herniations has been confusing, inconsistent, and contradictory. In 2014, the North American Spine Society, the American Society of Spine Radiology, and the American Society of Neuroradiology convened a combined task force to agree upon the nomenclature, including (2):
The Normal Disk
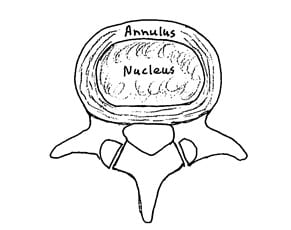
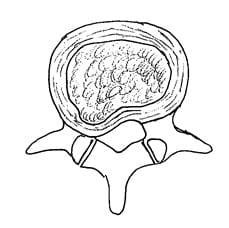
The Bulging Disk
If any part of the annulus extends beyond the normal disc space, it is considered to be a bulging disk.
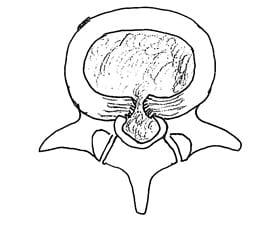
The Protrusion Disk
In the protrusion disk, the base of the displaced material is greater than the distance the disk material had moved towards the intervertebral foramen and/or the central neural canal.
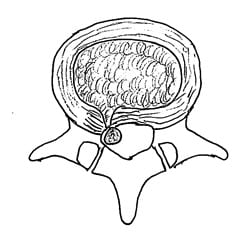
The Extrusion Disk
In the extrusion disk, the greatest measure of the displaced disk material is greater than the measure of the base of the displaced material.
The Sequestration Disk
In the sequestration disk, the disk material has lost all connection with the original disk material.
••••••••••
How Important Are Imaging Findings in the Genesis of Low Back Pain?
Spinal imaging finding are important for many reasons, including all of the reasons mentioned above. Ironically, one of the least important reasons for spinal imaging is to determine the source of a patient’s pain.
•••••
In 1990, researchers from the Department of Orthopaedic Surgery at George Washington University Medical Center produced a study where 67 subjects who had never had low-back pain, sciatica, or neurogenic claudication received MRIs (3).
About one-third of the subjects had a substantial abnormality on imaging:
- Of those who were less than 60 years old, 20% had a herniated nucleus pulposus.
- In the group that was more than 60 years old, 57% had abnormal imaging: 36% had a herniated nucleus pulposus and 21% had spinal stenosis.
- Disc degeneration or bulging occurred at at least 1 lumbar level in 35% of the subjects between 20 and 39 years of age.
- Disc degeneration or bulging occurred in all but one of the 60 to 80 year-old subjects.
•••••
In 1991, researchers from the Department of Neurology at the Medical College of Pennsylvania, performed magnetic resonance imaging of the lumbar spine on 66 asymptomatic subjects and found that 18% had either a disc protrusion or herniation (4).
An additional 39% had a bulge that was associated with degenerative disc disease. The authors also found examples of spinal stenosis, narrowed nerve root canals, osteophytes, and vertebral body involvement with multiple myeloma. The authors concluded:
“Degenerative disc disease is a common finding in asymptomatic adults that increases in frequency with age. It occurs more frequently in men and usually involves more than one level. The most common location is L5-S1.”
•••••
In 1994, researchers from Hoag Memorial Hospital, Newport Beach, California, performed MRI examinations on 98 asymptomatic subjects aged 20-80 years. The authors documented both disk abnormalities and non-disk abnormalities (5):
- 36% of the 98 asymptomatic subjects had normal disks at all levels.
- 52% of the subjects had a bulge at one or more level.
- 27% had a protrusion.
- 1% had an extrusion.
- 38% had an abnormality of more than one intervertebral disk.
- 19% had Schmorl’s nodes.
- 14% had annular defects.
- 8% had facet arthropathy.
- Again, only 36% had a normal disk at all levels.
The authors concluded that there was a “high prevalence of abnormalities in the lumbar spine on MRI examination of people without back pain.”
•••••
In 2009, researchers from Hakodate Central General Hospital in Japan, performed MRIs on 200 healthy subjects to establish the baseline data of degenerative disc disease. The subjects included 68 men and 132 women whose mean age was 40 years (range 30-55 years). For the entire group, they found this incidence of disc degeneration, by spinal segmental level, was (6):
- L1-L2 7.0%
- L2-L3 12.0%
- L3-L4 15.5%
- L4-L5 49.5%
- L5-S1 53.0%
•••••
In 2010, researchers from Boston University School of Medicine assessed the role of radiographic abnormalities in the etiology of nonspecific low back pain because of the strong influence radiographic findings have on medical decision making. They specifically looked at the prevalence of lumbar spine degeneration as evaluated with computed tomography (CT) (7):
- Intervertebral disc narrowing
- Facet joint osteoarthritis
- Spondylolysis
- Spondylolisthesis
- Central canal spinal stenosis
One hundred eighty seven subjects participated in the study: 104 men and 83 women, with a mean age of 53 years. Findings include:
- 64% had disk degeneration
- 65% had facet joint osteoarthritis
- 12% had spondylolysis
In this study, the only imaging finding that showed statistical significance associated with low back pain was central canal spinal stenosis.
Degenerative features of the lumbar spine were extremely prevalent in this community-based sample, but they were essentially not associated with low back pain.
•••••
In 2015, researchers from Mayo Clinic, the University of Washington, Oregon Health and Science University, Henry Ford Hospital in Detroit, University of California San Francisco, Kaiser Permanente in Oakland, California, reviewed the literature to estimate the prevalence, by decade age (20, 30, 40, 50, 60, 70, 80 years), of common degenerative spine conditions (8). Their systematic literature review used either CT and/or MRI imaging of 3,110 asymptomatic individuals from 33 studies that met the study inclusion criteria. The authors specifically identified and quantified the following degenerative markers:
In 2015, researchers from Mayo Clinic, the University of Washington, Oregon Health and Science University, Henry Ford Hospital in Detroit, University of California San Francisco, Kaiser Permanente in Oakland, California, reviewed the literature to estimate the prevalence, by decade age (20, 30, 40, 50, 60, 70, 80 years), of common degenerative spine conditions (8). Their systematic literature review used either CT and/or MRI imaging of 3,110 asymptomatic individuals from 33 studies that met the study inclusion criteria. The authors specifically identified and quantified the following degenerative markers:
- Disk degeneration
- Disk signal loss
- Disk height loss
- Disk bulge
- Disk protrusion
- Annular fissures
- Facet degeneration
- Spondylolisthesis
The authors began with this premise:
“Given the large number of adults who undergo advanced imaging to help determine the etiology of their back pain, it is important to know the prevalence of imaging findings of degenerative disease in asymptomatic populations.”
All study subjects were asymptomatic at the time of their imaging, and all had no history of back pain. Studies with patients with minor or low-grade back pain were excluded, as were patients with motor or sensory symptoms, tumors, or trauma.
The authors note that MR imaging is highly sensitive in detecting spinal degenerative changes, and that spinal degenerative changes often occur in pain-free individuals as well as those with back pain. They state:
“Findings such as disk degeneration, facet hypertrophy, and disk protrusion are often interpreted as causes of back pain, triggering both medical and surgical interventions, which are sometimes unsuccessful in alleviating the patient’s symptoms.”
“Prior studies have demonstrated that imaging findings of spinal degeneration associated with back pain are also present in a large proportion of asymptomatic individuals.”
“Imaging findings of spine degeneration are present in high proportions of asymptomatic individuals, increasing with age.”
“Many imaging-based degenerative features are likely part of normal aging and unassociated with pain.”
Findings by age decade included:
- “Disk degeneration prevalence ranged from 37% of asymptomatic individuals 20 years of age to 96% of those 80 years of age, with a large increase in the prevalence through 50 years.”
- “Disk bulge prevalence increased from 30% of those 20 years of age to 84% of those 80 years of age.”
- “Disk protrusion prevalence increased from 29% of those 20 years of age to 43% of those 80 years of age.”
- “The prevalence of annular fissure increased from 19% of those 20 years of age to 29% of those 80 years of age.”
- “Disk signal loss (“black disk”) was similarly present in more than half of individuals older than 40 years of age, and by 60 years, 86% of individuals had disk signal loss.”
- “Disk height loss and disk bulge were moderately prevalent among younger individuals, and prevalence estimates for these findings increased steadily by approximately 1% per year.”
- “Disk protrusion and annular fissures were moderately prevalent across all age categories but did not substantially increase with age.”
- Facet degeneration was “rare in younger individuals (4%–9% in those 20 and 30 years of age), but the prevalence increased sharply with age.”
- “Spondylolisthesis was not commonly found in asymptomatic individuals until 60 years, when prevalence was 23%; prevalence increased substantially at 70 and 80 years of age.”
These findings are summarized tin the following chart:
| Imaging Findings | 20s | 30s | 40s | 50s | 60s | 70s | 80s |
| Disk Degeneration | 37% | 52% | 68% | 80% | 88% | 93% | 96% |
| Disc Signal Loss | 17% | 33% | 54% | 73% | 86% | 94% | 97% |
| Disc Height Loss | 24% | 34% | 45% | 56% | 67% | 76% | 84% |
| Disk Bulge | 30% | 40% | 50% | 60% | 69% | 77% | 84% |
| Disk Protrusion | 29% | 31% | 33% | 36% | 38% | 40% | 43% |
| Annular Fissure | 19% | 20% | 22% | 23% | 25% | 27% | 29% |
| Facet Degeneration | 4% | 9% | 18% | 32% | 50% | 69% | 83% |
|
Spondylolisthesis |
3% |
5% |
8% |
14% |
23% |
35% |
50% |
This systematic review indicates that many imaging findings of degenerative spine disease have a high prevalence among asymptomatic individuals. Disk degeneration and signal loss were present in nearly 90% of individuals 60 years of age or older. The authors concluded:
“Our study suggests that imaging findings of degenerative changes such as disk degeneration, disk signal loss, disk height loss, disk protrusion, and facet arthropathy are generally part of the normal aging process rather than pathologic processes requiring intervention.”
“With a prevalence of degenerative findings of >90% in asymptomatic individuals 60 years of age or older, our study supports the hypothesis that degenerative changes observed on CT and MR imaging are often seen with normal aging.”
•••••
There are many reasons for spinal imaging, some of them are critical. Because there is poor correlation between imaged spinal degenerative changes and a patient’s back pain complaints, many chiropractors initially choose to forgo spinal imaging until response to clinical intervention is ascertained. Ultimately, the choice for spinal imaging or not is the call of the treating chiropractor who is looking out for the best interests of the patient.
REFERENCES
- Berman B; Zapped: From Infrared to X-rays, the Curious History of Invisible Light; Little Brown and Company, 2017.
Fardon DR, Williams LA, Dohring EJ, Rothan SL, Sze GK; Lumbar Disc Nomenclature: Version 2.0: Recommendations of the Combined task forces of the North American Spine Society, the American Society of Spine Radiology, and the American Society of Neuroradiology; Spine Journal; 2014; No. 14; pp. 2525-2545. - Boden SD, Davis DO, Dina TS, Patronas NJ, Wiesel SW; Abnormal magnetic-resonance scans of the lumbar spine in asymptomatic subjects. A prospective investigation; Journal of Bone and Joint Surgery; March 1990; Vol. 72; No. 3; pp. 403-408.
- Greenberg JO, Schnell; Magnetic resonance imaging of the lumbar spine in asymptomatic adults. Cooperative study–American Society of Neuroimaging; Journal of Neuroimaging; February 1991; Vol. 1; No. 1; pp. 2-7.
- Jensen MC, Brant-Zawadzki MN, Obuchowski N, Modic MT, Malkasian G, Ross JS; Magnetic resonance imaging of the lumbar spine in people without back pain; New England Journal of Medicine; July 14, 1994; Vol. 331; Vol. 2; pp. 69-67.
- Kanayama M, Togawa D, Takahashi C, Terai T, Hashimoto T; Cross-sectional magnetic resonance imaging study of lumbar disc degeneration in 200 healthy individuals’; Journal of Neurosurgery Spine; October 2009; Vol. 11; No. 4; pp. 501-507.
- Kalichman L, Kim DH, Li L, Guermazi A, Hunter DJ; Computed tomography-evaluated features of spinal degeneration: prevalence, intercorrelation, and association with self-reported low back pain; Spine Journal; March 2010; Vol. 10; No. 3; pp. 200-208.
- Brinjikji W, Luetmer PH, Comstock B, Bresnahan BW, Chen LE, Deyo RA, Halabi S, Turner JA, Avins AL, James K,
- Wald JT, Kallmes DF, Jarvik JG; Systematic Literature Review of Imaging Features of Spinal Degeneration in Asymptomatic Populations; American Journal of Neuroradiology (AJNR); April 2015; Vol. 36; No. 4; pp. 811–816.
“Authored by Dan Murphy, D.C.. Published by ChiroTrust® – This publication is not meant to offer treatment advice or protocols. Cited material is not necessarily the opinion of the author or publisher.”